Recording Science Results for Years 3 and 4: Dot's Garden Lab
Learn how to start recording science results with tally charts, tables, keys and bar charts, then report findings by building a display in Dot's Garden Lab.
Online game, chapter 1 free · Years 3 and 4 (KS2) · ages 7–9 · national curriculum in England · no adverts · plays on a phone, tablet or computer · no sign-up to start.
An online science game for Years 3 and 4 (KS2). It covers the national curriculum in England, Years 3–4 science: “Gathering, recording, classifying and presenting data in a variety of ways to help in answering questions”, and 2 more statements listed under the chapters.
5 short chapters, about 35 minutes in all. Children can stop after any chapter.
Start playing for free. Plays in the browser on phones, tablets and computers: no app, no adverts.
Free for teachers: every chapter on the whiteboard with a free teacher account.
Last updated · Checked against the national curriculum in England by the TapLearn team
What you'll learn
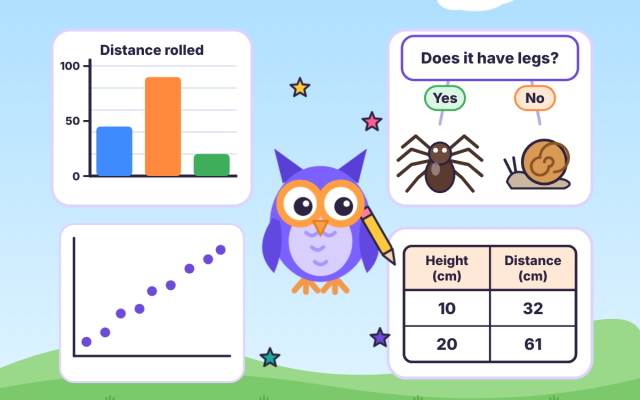
Count with tally marks in gates of five and find the frequency
Set out a results table with headings and units, such as Height (cm)
Label a science diagram with a title and ruled label lines
Use a yes/no branching key to sort and name minibeasts
Draw and read bar charts with scales in 2s, 5s and 10s
Write a conclusion that answers the question using evidence
Chapter by chapter
Count with tally marks and record results in a tableStart playing for free
Tally minibeasts in gates of five, turn the tallies into totals (the frequency), then build a results table with clear headings and units in the heading, such as Height (cm).
Years 3–4 science · 1Years 3–4 science · 2
Record with labelled diagrams and branching keys
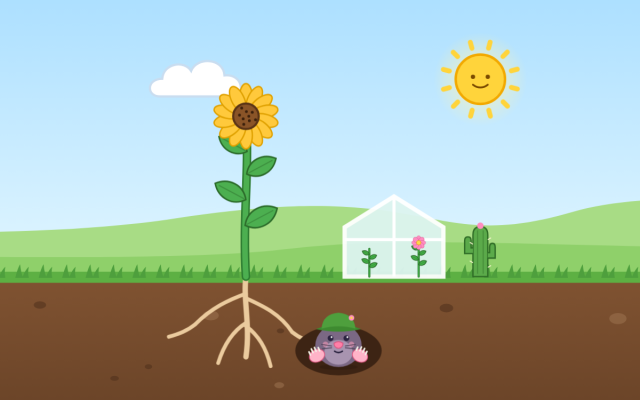
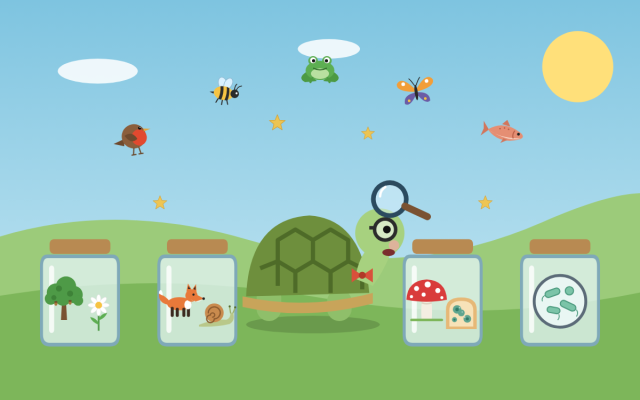
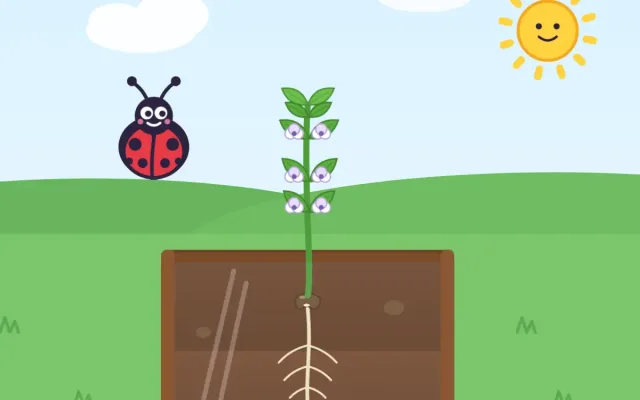
Label a bean plant with a title and straight ruled label lines that touch each part, then sort minibeasts into a yes/no branching key and use it to identify mystery creatures.
Years 3–4 science · 1Years 3–4 science · 2
Draw a bar chart with a title, axes, scale and bars
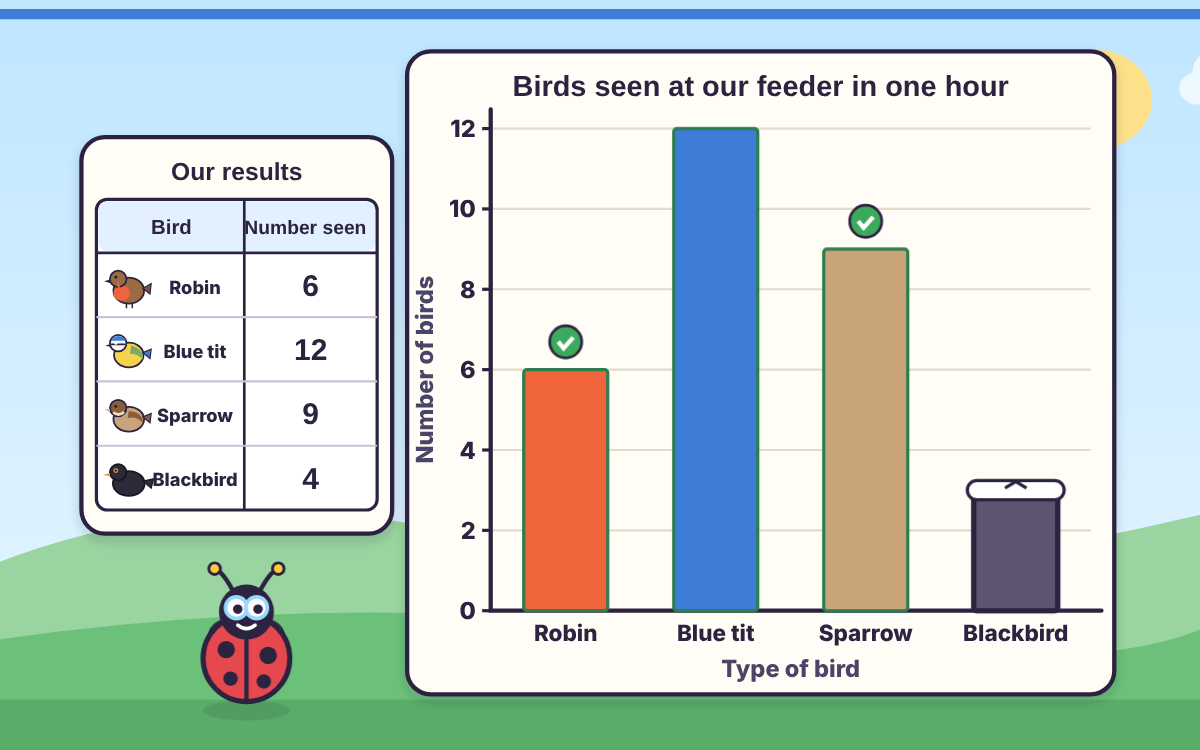
Turn a table of bird counts into a bar chart by choosing a clear title, placing the axis labels, picking a scale that starts at zero with equal steps, and dragging each bar to the right height.
Years 3–4 science · 1Years 3–4 science · 2
Read bar charts with scales of 2, 5 and 10
Read bar charts whose scales count in twos, fives and tens, including bars that stop halfway between two lines, answer how many more questions by finding the difference, and read results from a table.
Years 3–4 science · 1
Report findings with a conclusion and a display
Use results about ice cubes to write a conclusion starting I found that, back it up with evidence, avoid claiming more than the results show, suit the audience, and order a science display before presenting it.
What the chapters cover in the national curriculum in England:
Years 3–4 science: Gathering, recording, classifying and presenting data in a variety of ways to help in answering questions
Years 3–4 science: Recording findings using simple scientific language, drawings, labelled diagrams, keys, bar charts, and tables
Years 3–4 science: Reporting on findings from enquiries, including oral and written explanations, displays or presentations of results and conclusions
About this adventure
Recording Science Results is an interactive game for children aged 7–9 that teaches how scientists gather, record and present data with tally charts, tables, labelled diagrams, keys and bar charts, and how to report what they found.
Guided by Dot, a ladybird scientist, children tally minibeasts as they crawl out of a log, turn the tally marks into a frequency table with clear headings and units, and label a bean plant using ruled label lines. They sort minibeasts into a yes/no branching key, then build a bar chart step by step: title, axis labels, a scale that starts at zero, and bars of equal width.
Later they read scales that count in twos, fives and tens, including bars that stop halfway between lines, and answer "how many more" questions. Finally they write a conclusion using "I found that…" with evidence, think about their audience and present a science display.
Questions and answers
How do children record results in science?
Children record results by writing what they observe or measure as they go, often with tally marks, then putting the totals in a table with clear headings and units. They can then present the data as a bar chart, a labelled diagram or a key.
How do you draw a bar chart for a science investigation?
Give the chart a title, label both axes and choose a scale that starts at zero and goes up in equal steps, such as 2s, 5s or 10s. Then draw bars of equal width with gaps between them, lining the top of each bar up with the scale.
What is a branching key in science?
A branching key is a set of yes/no questions about features you can see, such as "Does it have legs?". Each answer leads to another question until the living thing is identified. Children in Year 4 use keys to sort and name plants and animals.
What age is this recording results game for?
It is designed for children aged 7 to 9, in Years 3 and 4 of primary school in England. It follows the Lower Key Stage 2 working scientifically statements on gathering, recording, presenting and reporting data.
What does the game include and how long does it take?
The game has five stations on tallies and tables, diagrams and keys, drawing bar charts, reading bar charts, and reporting findings, plus a 10-question challenge. Playing everything takes about 35 minutes, and each station can be played on its own.
We count visits to make TapLearn better.We use one cookie, only on this site, to see how families find and use it. No adverts, and nothing is shared.One cookie, only on this site. No adverts.How we measure

 TapLearn