Recording Science Results for Years 5 and 6: Graphs and Keys
Learn how to record science results with labelled diagrams, keys, tables and graphs, then write conclusions you can trust, with Dot the owl.
Online game, chapter 1 free · Years 5 and 6 (KS2) · ages 9–11 · national curriculum in England · no adverts · plays on a phone, tablet or computer · no sign-up to start.
An online science game for Years 5 and 6 (KS2). It covers the national curriculum in England, Years 5–6 science: “Recording data and results of increasing complexity using scientific diagrams and labels, classification keys, tables, scatter graphs, bar and line graphs”, and 1 more statement listed under the chapters.
6 short chapters, about 40 minutes in all. Children can stop after any chapter.
Start playing for free. Plays in the browser on phones, tablets and computers: no app, no adverts.
Free for teachers: every chapter on the whiteboard with a free teacher account.
Last updated · Checked against the national curriculum in England by the TapLearn team
What you'll learn
Draw scientific diagrams with a title, ruled labels and circuit symbols
Use a classification key and write good yes or no questions
Set out a results table with units in the column headings
Spot an odd result and find the average of repeat readings
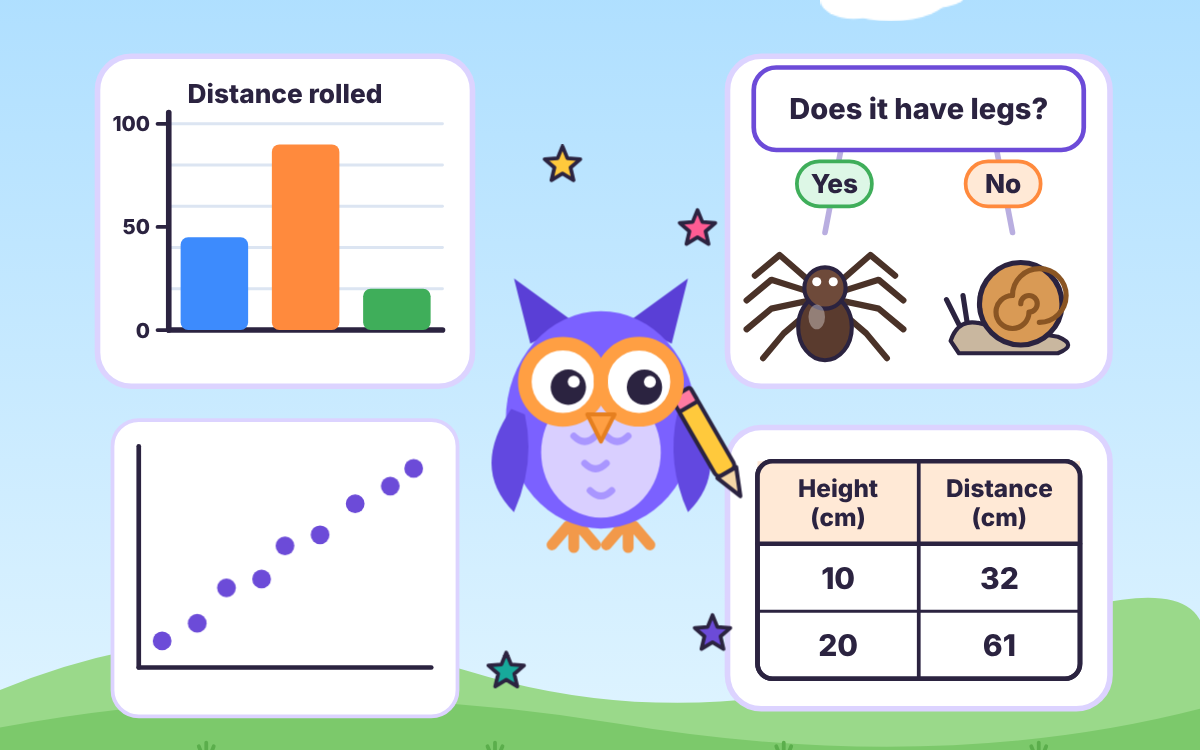
Choose, plot and read bar, line and scatter graphs
Write a conclusion and say how much to trust the results
Chapter by chapter
Draw clear scientific diagrams with labels and symbolsStart playing for free
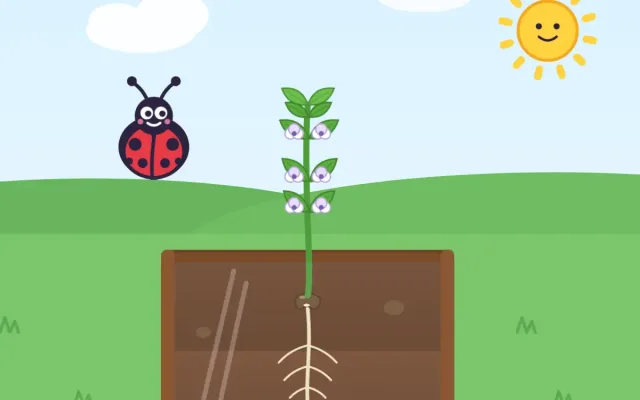
Learn what makes a diagram scientific: a title, clear lines and ruled labels that touch each part. Children label a plant, fix messy label lines and match circuit symbols for a cell, bulb, switch and motor.
Years 5–6 science · 1
Use and build classification keys
Follow a classification key with yes or no questions to name pond creatures, then build a key for an owl, bat, goldfish and frog by choosing questions that split each group (branching keys).
Years 5–6 science · 1
Set out results tables with units and repeat readings
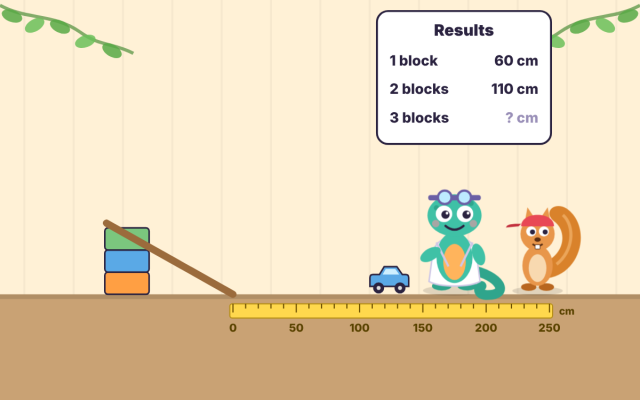
Set up a results table for a ramp test with the changed variable first and units in the headings. Children spot an anomalous result, retest it and calculate the average (mean) of three repeat readings.
Years 5–6 science · 1
Choose, draw and read bar and line graphs
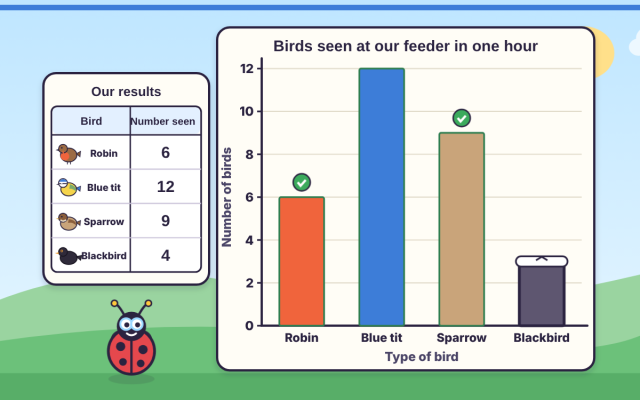
Decide when separate groups need a bar graph and smooth changes need a line graph. Children drag bars to match a table, plot cooling-water temperatures, read between points and spot an uneven scale.
Years 5–6 science · 1
Plot scatter graphs and spot patterns
Plot children's heights and arm spans as dots on a scatter graph and describe the pattern. Children match investigations to rising, falling or no-pattern graphs and learn that a pattern is not always a cause.
Years 5–6 science · 1Years 5–6 science · 2
Write conclusions and judge how much to trust results
Turn ramp results into a written conclusion, explain the pattern using science and compare two teams' data to judge trust. Children pick what makes results reliable and finish a science fair poster.
What the chapters cover in the national curriculum in England:
Years 5–6 science: Recording data and results of increasing complexity using scientific diagrams and labels, classification keys, tables, scatter graphs, bar and line graphs
Years 5–6 science: Reporting and presenting findings from enquiries, including conclusions, causal relationships and explanations of and a degree of trust in results, in oral and written forms such as displays and other presentations
About this adventure
Recording Science Results is an interactive game that teaches children aged 9–11 how to record and present results in science, matching the Years 5–6 working scientifically curriculum in England.
At Dot's Field Station, players label a plant diagram, read circuit symbols, follow and build classification keys, and set out results tables with units in the headings. They spot an anomalous (odd) result, work out the average (mean) of repeat readings, decide between bar graphs and line graphs, drag bars and points into place, and plot a scatter graph to find a pattern.
The final station turns results into a conclusion: what the pattern is, why it happened and how far the results can be trusted. Players learn that a pattern does not always mean one thing causes another, then test themselves in a ten-question challenge.
Questions and answers
How do you record results in a science investigation?
Results are usually recorded in a table first, with what you changed in the first column and what you measured next, and units written once in the headings. They can then be shown as a bar, line or scatter graph to make the pattern easy to see.
When should you use a line graph instead of a bar graph in science?
Use a line graph when the thing you changed is a measurement that varies smoothly, such as time or temperature. Use a bar graph when it is a set of separate groups, such as types of surface or different habitats.
What is a classification key, in simple words?
A classification key is a chain of yes or no questions about features you can see, such as 'Does it have legs?'. Each answer splits a group in two until only one living thing or object is left, so you can name it.
What age is this recording results game for?
The game is designed for children aged 9 to 11, in Years 5 and 6. It follows the working scientifically part of the science curriculum in England and suits upper Key Stage 2 learners.
What does the game include and how long does it take?
There are six stations covering diagrams, keys, tables, bar and line graphs, scatter graphs and conclusions, plus a ten-question challenge. Playing everything takes about 40 minutes, and each station can be played on its own.
We count visits to make TapLearn better.We use one cookie, only on this site, to see how families find and use it. No adverts, and nothing is shared.One cookie, only on this site. No adverts.How we measure
 TapLearn