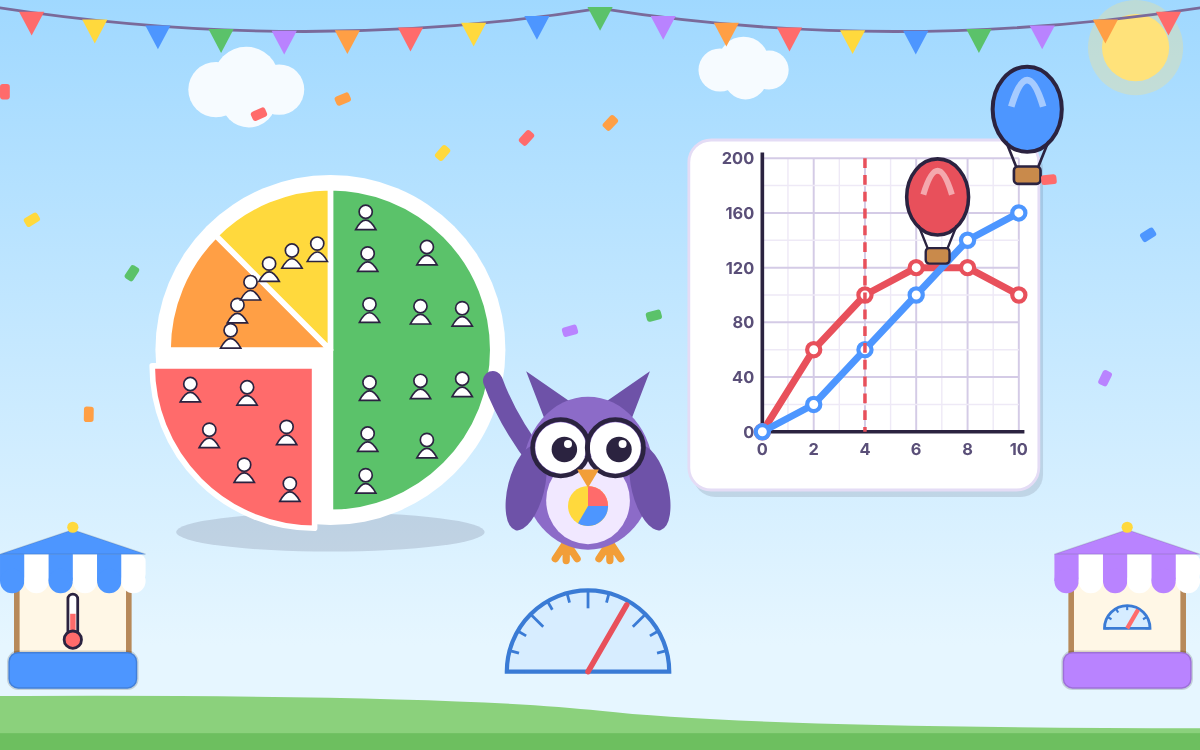
Pie Charts and Line Graphs: A Day at the Great Graph Fair
Learn to read and draw pie charts and line graphs, then solve problems with them as you visit six stalls at a summer fair with Dot the owl.
- Ages 10–11
- About 60 min
- Some thinking
- Data & Chance
Learn to read and draw pie charts and line graphs, then solve problems with them as you visit six stalls at a summer fair with Dot the owl.
Year 6 maths · 1
Year 6 maths · 1
Year 6 maths · 1
Year 6 maths · 1
Year 6 maths · 1
Year 6 maths · 1
What the chapters cover in the national curriculum in England:
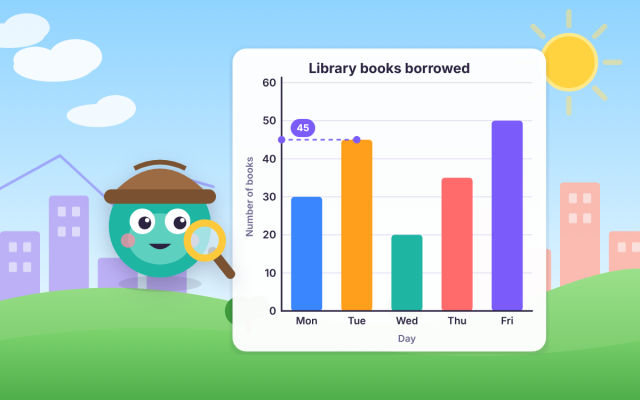
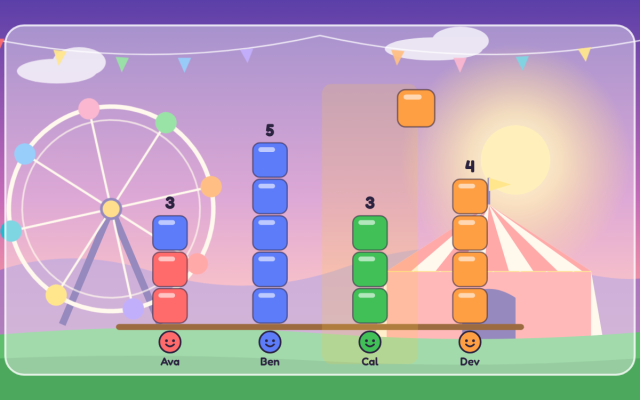
Pie Charts and Line Graphs is an interactive maths game that teaches children aged 10–11 how to read, draw and solve problems with pie charts and line graphs, following the Year 6 national curriculum.
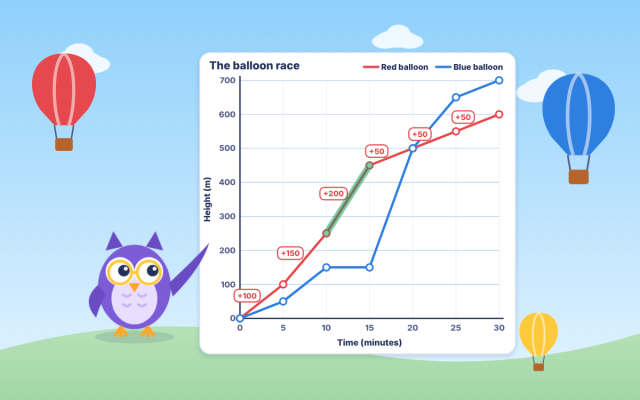
Players drag a reading ruler along a temperature graph, plot a sunflower's growth week by week and compare two hot air balloons on one graph. They use a conversion graph to change miles into kilometres. At the pie stalls they work out what each slice stands for using fractions, percentages and angles. Then they draw their own pie chart by dividing 360° by the total and measuring each angle with an on-screen protractor.
Dot the owl reads every instruction aloud and gives a hint after a wrong answer, aimed at the exact mistake. Two optional warm-ups refresh reading scales and fractions of amounts, and a 10-question final challenge checks everything.
Work out what fraction of the circle a slice is, then find that fraction of the total. For example, if 24 people were asked and a slice is a quarter, it stands for 24 ÷ 4 = 6 people.
Divide 360° by the total to find the angle for one item, then multiply by each group's amount. If 18 children vote, each child is 360 ÷ 18 = 20°, so 6 votes make a 120° slice. The angles should add up to 360°.
Use a line graph when something changes smoothly, such as temperature or height over time, because the points in between have meaning. A pie chart is better for showing how a whole is split into separate groups, such as favourite flavours.
It is written for children aged 10–11 in Year 6, where pie charts and line graphs are taught in the statistics part of the national curriculum. Older children revising for KS2 SATs can also use it.
It has six chapters, two optional warm-ups and a 10-question final challenge, taking about an hour to play in full. Each chapter takes around 8–10 minutes, so it can be played in short sessions.

 TapLearn
Getting it ready…
Great work on chapter 1! To open the next chapters, ask a grown-up to take a look.
To play this game, ask a grown-up to take a look. There are lots of free games you can play right now too!
Create a free family account and your child can play every chapter of every game for 7 days, with no card needed. Their progress is kept. After that, the free plan is free for ever, and membership is £6.99 a month if you'd like to keep every chapter.
That's all the learning time for today. Great work! Flip will be ready to play again tomorrow.