Tally Charts and Pictograms: A Data Park Detective Game
Learn to read and make tally charts and pictograms, then sort pond animals, build block diagrams and compare data with Pip the owl.
- Ages 6–8
- About 40 min
- Easy start
- Data & Chance
Learn to read and make tally charts and pictograms, then sort pond animals, build block diagrams and compare data with Pip the owl.
Year 2 maths · 1 Year 2 maths · 2
Year 2 maths · 1 Year 2 maths · 2 Year 2 maths · 3
Year 2 maths · 1 Year 2 maths · 2
Year 2 maths · 1 Year 2 maths · 2
Year 2 maths · 2 Year 2 maths · 3
What the chapters cover in the national curriculum in England:
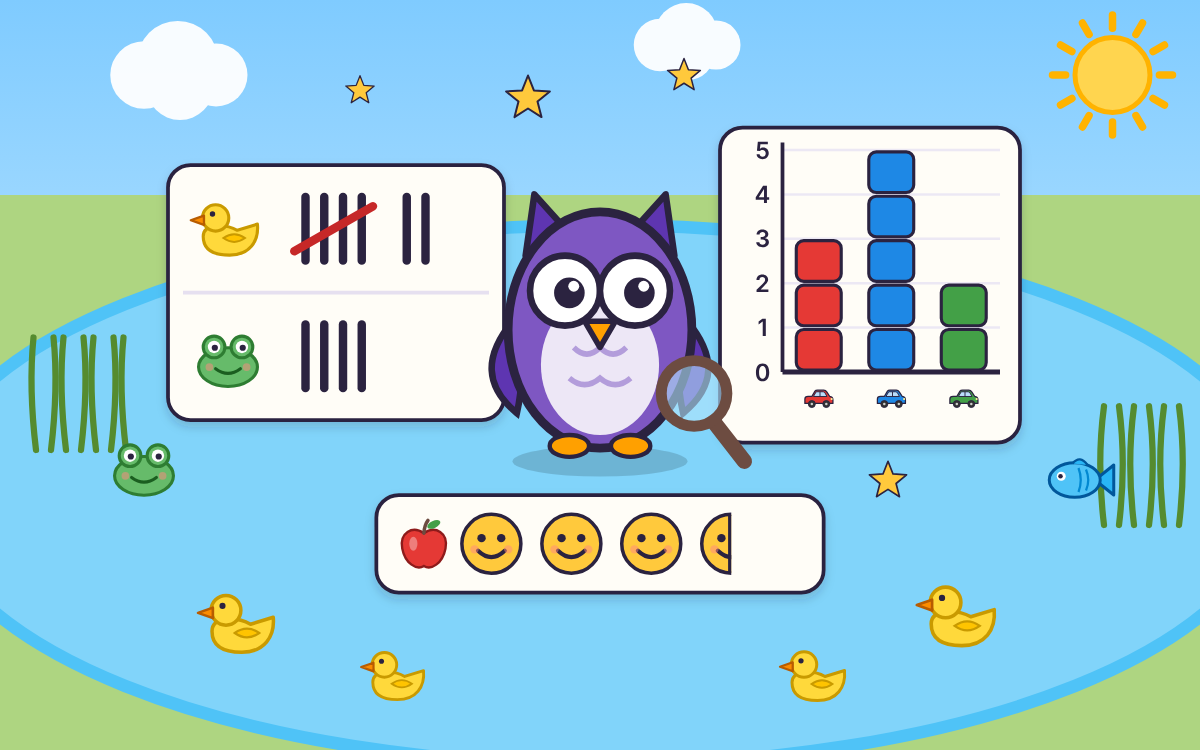
Tally Charts and Pictograms is an interactive maths game that teaches children aged 6–8 how to read and make tally charts, pictograms, block diagrams and simple tables. It follows the Year 2 statistics objectives in the national curriculum for England.
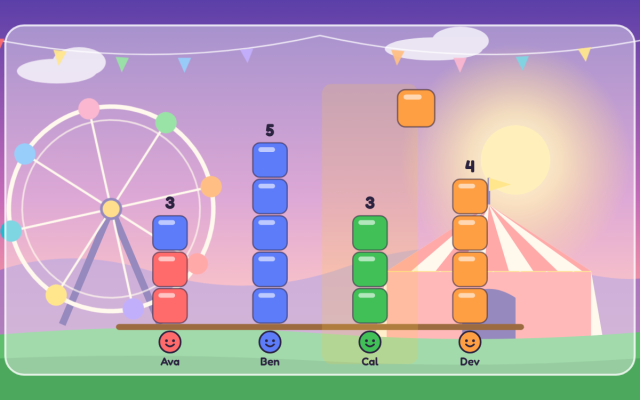
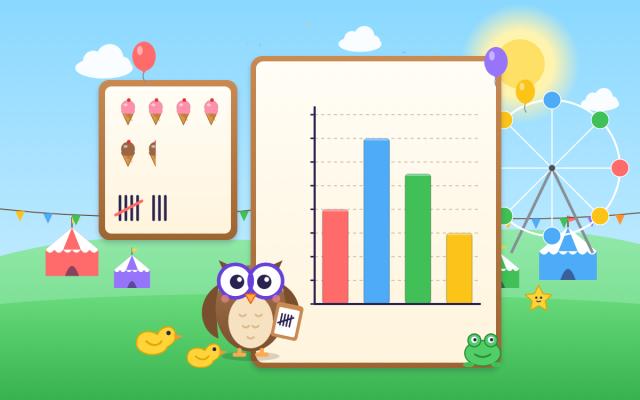
Guided by Pip the owl, children tap ducks to draw tally marks, drag pond animals into a tally chart, stack blocks for passing cars and add faces to pictograms. Along the way they learn that a tally gate means five, that a pictogram's key tells you what each picture is worth, and that half a picture is worth half as much.
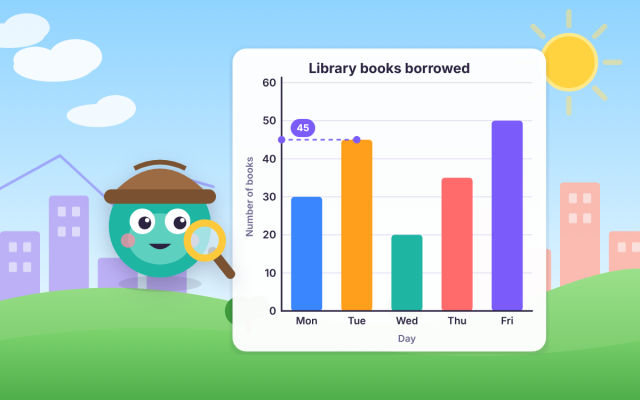
Children then use the data to answer questions. They count each group, sort groups from most to fewest, add to find totals, and find the difference for 'how many more' questions. Short spoken instructions, sound effects and a final challenge give them plenty of practice.
A tally chart records how many things you count by drawing one mark for each. Every fifth mark is drawn across the other four to make a gate, so you can count the gates quickly in fives.
Read the key first to find out what one picture stands for, then count the pictures in each row using that value. If one picture means 2, three pictures mean 6 and half a picture means 1.
A block diagram shows each counted thing as one block, stacked into towers that you read using the numbers up the side. A pictogram uses rows of pictures, and its key can make each picture stand for more than one thing.
It is designed for children aged 6 to 8 and matches the Year 2 statistics objectives in the national curriculum for England. Older children who need a refresher on reading charts can use it too.
It has five chapters, an optional warm-up on counting in 2s and 5s, and a 10-question Data Detective Challenge. Playing everything takes about 40 minutes, and children can start any chapter from the map.



 TapLearn
Getting it ready…
Great work on chapter 1! To open the next chapters, ask a grown-up to take a look.
To play this game, ask a grown-up to take a look. There are lots of free games you can play right now too!
Create a free family account and your child can play every chapter of every game for 7 days, with no card needed. Their progress is kept. After that, the free plan is free for ever, and membership is £6.99 a month if you'd like to keep every chapter.
That's all the learning time for today. Great work! Flip will be ready to play again tomorrow.