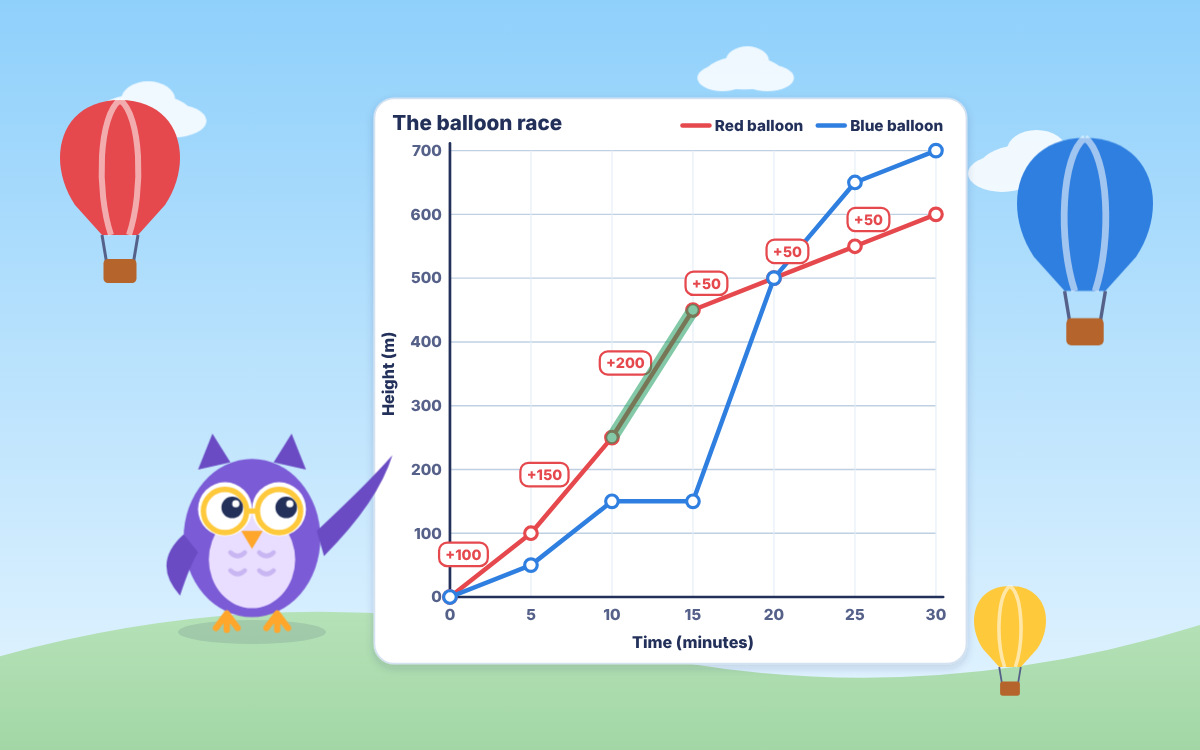
Line Graphs: Read, Compare and Solve at Skyline Station
Learn to read line graphs and use them to find totals and differences, by plotting points and reading balloon heights with Nova the owl.
- Ages 8–11
- About 50 min
- Some thinking
- Data & Chance
Learn to read line graphs and use them to find totals and differences, by plotting points and reading balloon heights with Nova the owl.
Year 5 maths · 1
Year 5 maths · 1
Year 5 maths · 1
Year 5 maths · 1
Year 5 maths · 1
Year 5 maths · 1
What the chapters cover in the national curriculum in England:
Line Graphs: Read, Compare and Solve at Skyline Station is an interactive maths game that teaches children aged 8–11 how to read line graphs and use them to solve comparison, sum and difference problems, matching the Year 5 statistics curriculum in England.
Guided by Nova, a weather owl, players plot temperatures from a table, drag markers to read values up and across from the axes, and find how much a sunflower grew or a tank filled. They meet the key ideas: the horizontal and vertical axes, the scale, gridlines, reading values halfway between gridlines, and using a key when a graph has two lines.
The game also tackles common mistakes, such as counting each gridline as 1 or choosing the highest point when the question asks for the steepest part, where a value changes fastest. Spoken instructions, hints after a wrong answer and optional warm-ups support every step.
Find the value you know on one axis, go straight to the line, then go straight across or down to the other axis and read the scale. Always check what each gridline is worth before you read.
Read the two values from the graph, then subtract the smaller from the larger. Counting on works well too: to go from 35 to 80, count 5 to reach 40, then 40 more, which makes a difference of 45.
A flat part means the value stayed the same during that time. It does not mean the value was zero. For example, a flat line on a distance graph shows that someone stopped for a rest.
It is written for children aged 8 to 11 and matches the Year 5 maths curriculum in England. Year 4 pupils who already know line graphs and Year 6 pupils who want revision can also use it.
There are six chapters, two optional warm-ups and a ten-question final challenge, taking about 50 minutes in all. Children can play one chapter at a time, and each chapter takes roughly six to eight minutes.



 TapLearn
Getting it ready…
Great work on chapter 1! To open the next chapters, ask a grown-up to take a look.
To play this game, ask a grown-up to take a look. There are lots of free games you can play right now too!
Create a free family account and your child can play every chapter of every game for 7 days, with no card needed. Their progress is kept. After that, the free plan is free for ever, and membership is £6.99 a month if you'd like to keep every chapter.
That's all the learning time for today. Great work! Flip will be ready to play again tomorrow.