Bar Charts and Pictograms: Tally's Chart Fair Adventure
Learn to read and make bar charts and pictograms, tally charts and tables, then solve how many more and fewer puzzles at a lively fair.
- Ages 7–9
- About 50 min
- Easy start
- Data & Chance
Learn to read and make bar charts and pictograms, tally charts and tables, then solve how many more and fewer puzzles at a lively fair.
Bar Charts and Pictograms is an interactive game that teaches children aged 7–9 how to read and make bar charts, pictograms, tally charts and tables, following the Year 3 maths curriculum. Tally the data owl guides players round a fair, with spoken instructions and short captions.
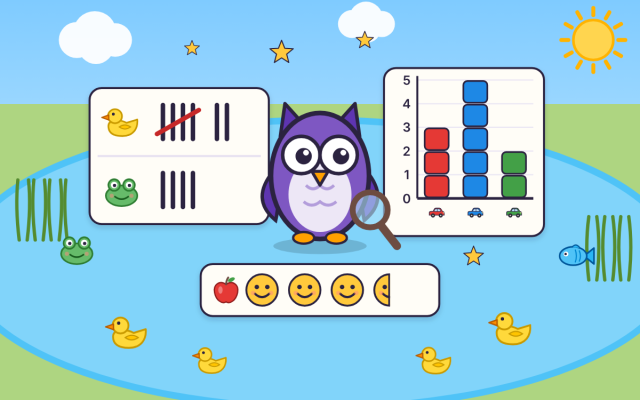
Children count pond visitors with tally marks, crossing every fifth mark to make a gate of five. They read pictogram keys where one picture stands for 2, 5 or 10, including half pictures. They also drag bars to the right height on a scale that counts in 2s, 5s or 10s. In two-way tables they find where a row and a column meet, and use the totals.
At the detective stall, players answer how many more and how many fewer questions, solve two-step puzzles and spot a chart whose scale does not start at zero. A 12-question challenge ends the game.
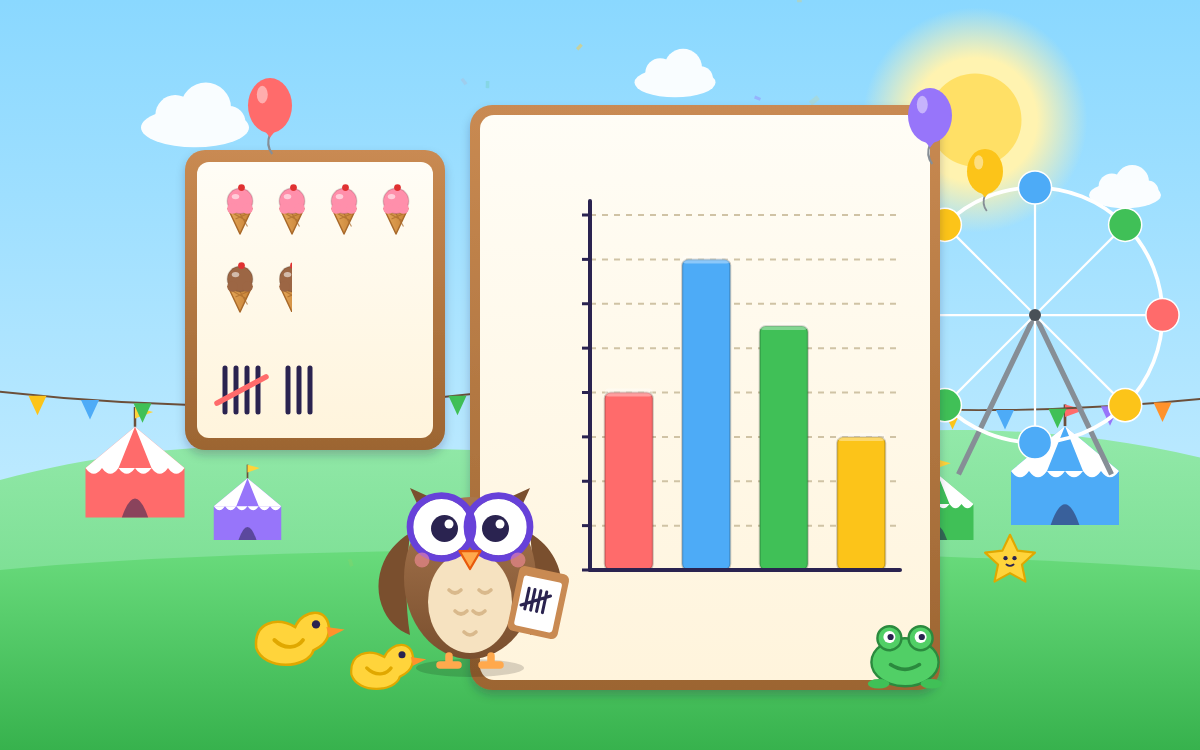
A pictogram is a chart that uses pictures to show data. A key tells you how many each picture stands for, so if one ice-cream cone stands for 2, half a cone stands for 1.
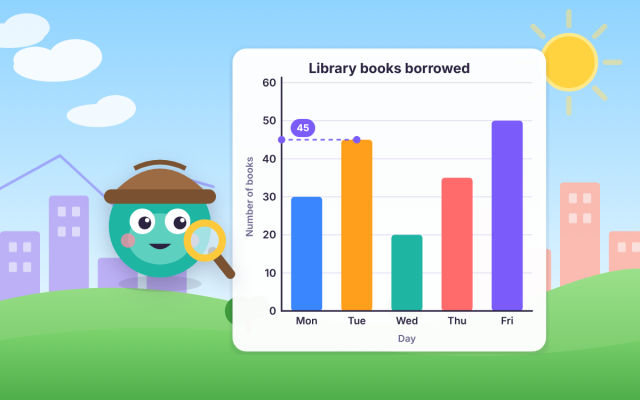
To read a bar chart, find the top of a bar and slide across to the scale at the side. If the bar stops halfway between two numbers on the scale, such as 6 and 8, its value is the number in the middle, which is 7.
Tally marks are lines you draw to count things as you see them, one line for each thing. Every fifth line crosses the four before it to make a gate, so you can count the total quickly in fives.
The game is written for children aged 7 to 9 and follows the Year 3 statistics part of the national curriculum for England. Older pupils who want quick revision of pictograms, bar charts and tables can also use it.
The game has five stalls on tally charts, pictograms, bar charts, tables and data puzzles, plus a 12-question final challenge. Playing everything takes about 50 minutes, and children can start at any stall and carry on later.

 TapLearn
Getting it ready…
Great work on chapter 1! To open the next chapters, ask a grown-up to take a look.
To play this game, ask a grown-up to take a look. There are lots of free games you can play right now too!
Create a free family account and your child can play every chapter of every game for 7 days, with no card needed. Their progress is kept. After that, the free plan is free for ever, and membership is £6.99 a month if you'd like to keep every chapter.
That's all the learning time for today. Great work! Flip will be ready to play again tomorrow.