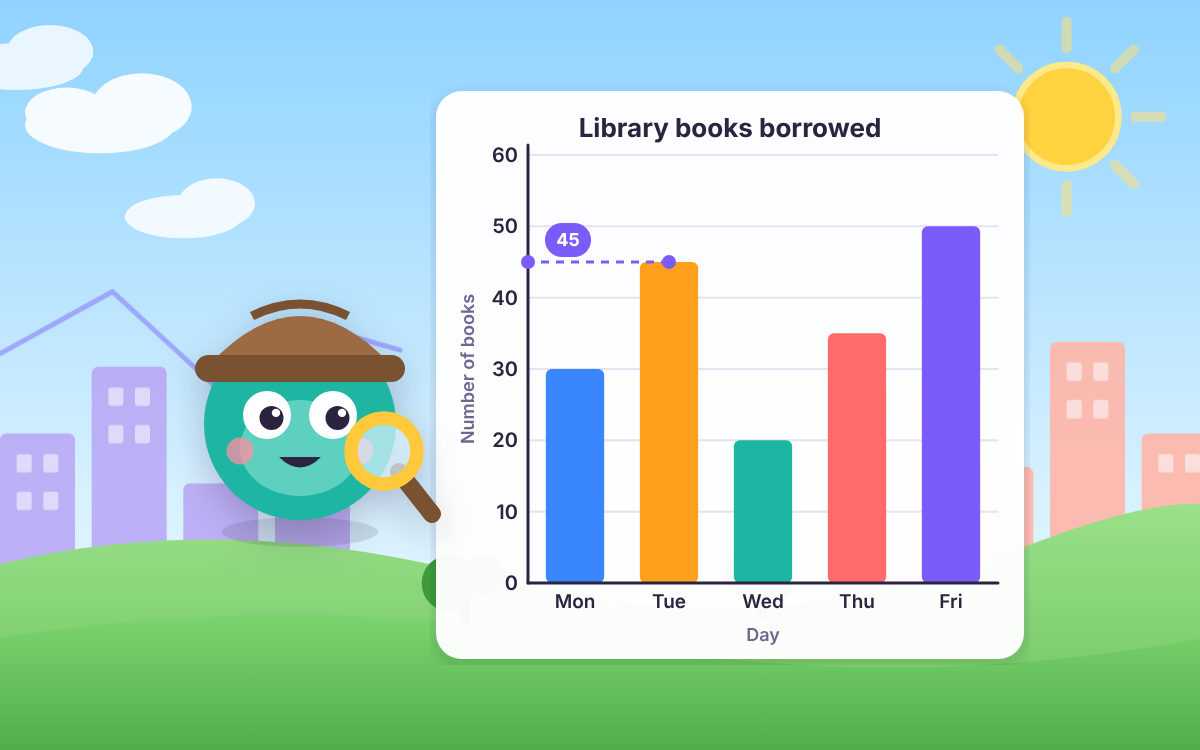
Charts and Graphs: A Data Detective Case with Dot
Learn to read and draw charts and graphs: drag bars, plot time graph points and solve how many more and how many altogether questions.
- Ages 8–10
- About 45 min
- Some thinking
- Data & Chance
Learn to read and draw charts and graphs: drag bars, plot time graph points and solve how many more and how many altogether questions.
Year 4 maths · 1
Year 4 maths · 1
Year 4 maths · 1
Year 4 maths · 2
Year 4 maths · 1 Year 4 maths · 2
Year 4 maths · 2
What the chapters cover in the national curriculum in England:
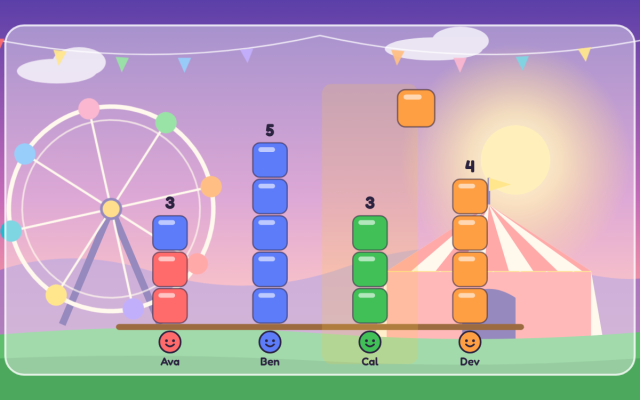
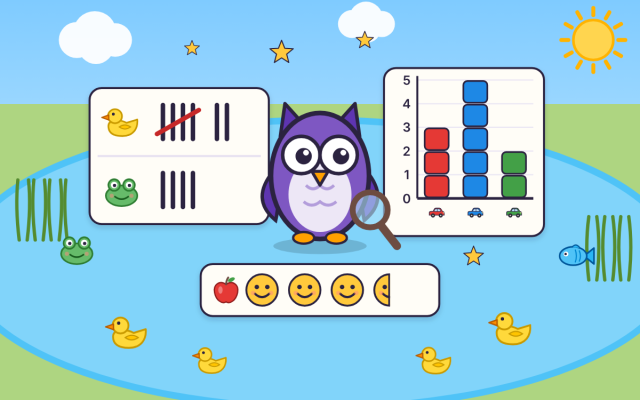
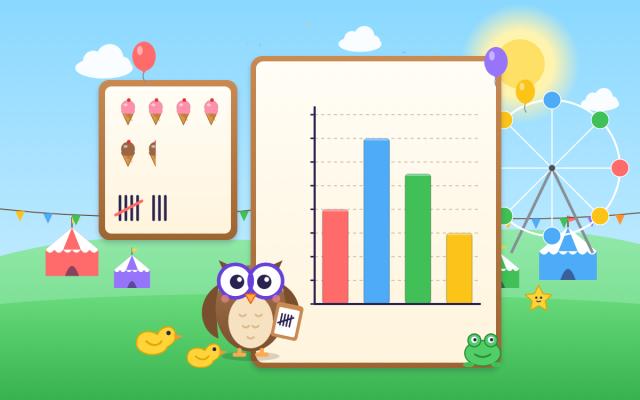
Charts and Graphs is an interactive maths game that teaches children aged 8–10 how to read and present data in bar charts, pictograms, tables and time graphs, following Year 4 statistics in the national curriculum for England.
Guided by Dot the data detective, players sort discrete data (counted in whole numbers) from continuous data (measured, so it can be any amount in between). They check what a scale goes up in before reading a bar, work out halfway values, choose a scale that fits, drag bars to the right height, and plot points on a time graph before joining them with straight lines.
Players then type answers to how many more, how many fewer and altogether questions, learning that comparing means subtracting and finding a total means adding. Spoken narration, hints and worked answers support every step.
Discrete data is counted in whole numbers, like the number of pets in a class, so you cannot have half of one. Continuous data is measured and can be any amount in between, like a plant's height or the temperature outside.
First check what the scale goes up in, such as 5s or 10s, then go straight across from the top of the bar to the scale. If the bar stops halfway between two lines, find the number exactly halfway between them.
A time graph is a line graph that shows how something changes over time, such as the temperature during a school day. Time goes along the bottom, the measurement goes up the side, and the plotted points are joined with straight lines.
It is designed for children aged 8 to 10 and matches the Year 4 statistics objectives in the national curriculum for England. Children who need a reminder can start with the warm-up on pictograms and bar charts, and older children can use it for revision.
The game has six chapters, a short Year 3 warm-up and a 10-question final challenge, taking about 45 minutes to play everything. Each chapter has spoken narration, hands-on activities, typed answers and hints, and can be played on its own.



 TapLearn
Getting it ready…
Great work on chapter 1! To open the next chapters, ask a grown-up to take a look.
To play this game, ask a grown-up to take a look. There are lots of free games you can play right now too!
Create a free family account and your child can play every chapter of every game for 7 days, with no card needed. Their progress is kept. After that, the free plan is free for ever, and membership is £6.99 a month if you'd like to keep every chapter.
That's all the learning time for today. Great work! Flip will be ready to play again tomorrow.